In the definition of kinetic molecular theory, we defined gases as a collection of particles in motion:
Statement 1: Gases are composed of particles that are in continuous motion, travelling in straight lines and changing direction only when they collide with other particles or with the walls of a container.
In a sample of a gas, the individual particles will be travelling at a variety of speeds and they are constantly colliding, transferring energy, and changing direction. However, because there are so many particles, the average speed is constant, as is the distribution of speeds (at least for a closed sample of gas at a constant temperature.
The distribution of molecular speeds for a sample of oxygen (O2) at 300 K is shown in the figure below:
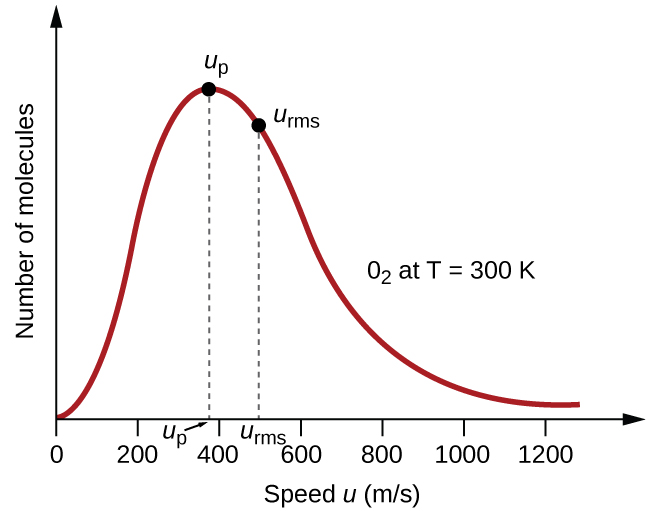
Notice that in this distribution, very few molecules move at either very low or very high speeds. The number of molecules with intermediate speeds increases rapidly up to a maximum, which is the most probable speed, then drops off rapidly. Because of the long “tail” of faster-moving molecules, the average speed is slightly higher than the most probable speed.
This distribution of speeds is called the Boltzmann-Maxwell Distribution, after the two scientists who derived and refined it. This distribution is calculated using the formula
$$F(u) = 4\pi \left(\frac{M}{2\pi RT}\right)^{3/2}u^2 e^{-Mu^2 / 2RT}$$
where:
$F(u)$ is the fraction of gas particles having speed “$u$” (in m/s)
$M$ is the molar mass of the gas
$R$ is the ideal gas constant in Kelvin
$T$ is the Kelvin temperature of the gas.
From here, we can see that temperature and molar mass will affect the speed distribution of particles in our gas sample. In the next few pages, we’ll investigate the origins and implications of this for our observable gas properties.