Objectives
By the end of this section, you will be able to:
- Explain the function of a catalyst in terms of reaction mechanisms and potential energy diagrams
- List examples of catalysis in natural and industrial processes
Among the factors affecting chemical reaction rates discussed earlier in this chapter was the presence of a catalyst, a substance that can increase the reaction rate without being consumed in the reaction. The concepts introduced in the previous section on reaction mechanisms provide the basis for understanding how catalysts are able to accomplish this very important function.
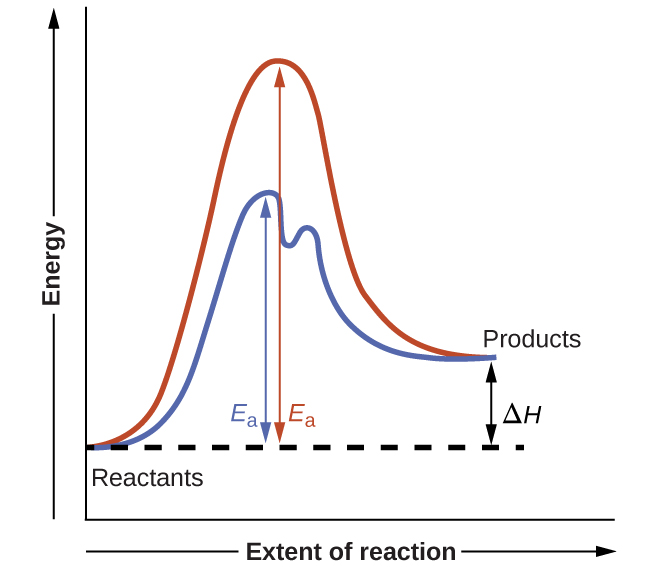
The figure below shows reaction diagrams for a chemical process in the absence and presence of a catalyst. Inspection of the diagrams reveals several traits of these reactions. Consistent with the fact that the two diagrams represent the same overall reaction, both curves begin and end at the same energies (in this case, because products are more energetic than reactants, the reaction is endothermic). The reaction mechanisms, however, are clearly different. The uncatalyzed reaction proceeds via a one-step mechanism (one transition state observed), whereas the catalyzed reaction follows a two-step mechanism (two transition states observed) with a notably lesser activation energy. This difference illustrates the means by which a catalyst functions to accelerate reactions, namely, by providing an alternative reaction mechanism with a lower activation energy. Although the catalyzed reaction mechanism for a reaction needn’t necessarily involve a different number of steps than the uncatalyzed mechanism, it must provide a reaction path whose rate determining step is faster (lower Ea).
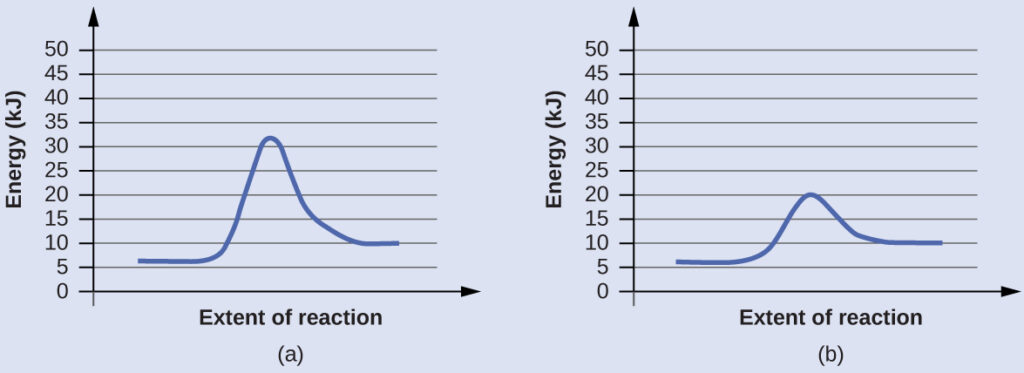
Reaction Diagrams for Catalyzed Reactions
The two reaction diagrams here represent the same reaction: one without a catalyst and one with a catalyst. Estimate the activation energy for each process, and identify which one involves a catalyst.
Solution
Activation energies are calculated by subtracting the reactant energy from the transition state energy.
$$\text{diagram (a): } E_a=32\;kJ−6\;kJ=26\;kJ$$
$$\text{diagram (b): }E_a=20\;kJ−6\;kJ=14\;kJ$$
The catalyzed reaction is the one with lesser activation energy, in this case represented by diagram b.
Check Your Learning
Reaction diagrams for a chemical process with and without a catalyst are shown below. Both reactions involve a two-step mechanism with a rate-determining first step. Compute activation energies for the first step of each mechanism, and identify which corresponds to the catalyzed reaction. How do the second steps of these two mechanisms compare?

Answer:
For the first step, Ea = 80 kJ for (a) and 70 kJ for (b), so diagram (b) depicts the catalyzed reaction. Activation energies for the second steps of both mechanisms are the same, 20 kJ.