Calculating an average rate of disappearance
Hydrogen peroxide (H2O2) decomposes according to the equation: $$2\; H_{2}O_{2}\;(aq) \rightarrow 2\;H_2 O \;(l)+ O_2\;(g)$$
The table below provides an example of data collected during the decomposition of H2O2, measured at 40 °C. Using this data, calculate the rate of disappearance of H2O2 from t = 0 to t = 6h.
| Time (h) | $[H_2 O_2]$ (M) |
| 0.00 | 1.000 |
| 6.00 | 0.500 |
| 12.00 | 0.250 |
| 18.00 | 0.125 |
| 24.00 | 0.0625 |
To calculate the rate of disappearance of hydrogen peroxide over the first 6h period, we should use the data for t = 0.00 h and t = 6.00h:
$$ \frac{\Delta [H_2 O_2 ]}{\Delta t} \;=\; \frac{-(0.500 mol/L \; -\; 1.000 mol/L)}{6.00\; h \;- \; 0.00\; h}\; =\; -\;0.0833\;mol\; L^{-1} h^{-1} $$
So the concentration of peroxide was decreasing by 0.0833 mol/L (on average) during the first 6-h time period.
Reaction rates can change over time
If you continue calculating the rate of disappearance from the data above, you will notice that the reaction rates vary with time, decreasing as the reaction proceeds. Results for the last 6-hour period yield a reaction rate of: $$ \frac{\Delta [H_2 O_2 ]}{\Delta t} \;=\; \frac{(0.0625 mol/L \; -\; 0.125 mol/L)}{24.00\; h \;- \; 18.00\; h}\; =\;-\; 0.010\;mol\; L^{-1} h^{-1} $$
The rate of disappearance during the final 6 hours is much slower – about 8x slower than the rate during the first 6 hours.
The rate of a reaction generally slows with time. This is one of the important differences between calculating average and instantaneous rates. We can explain why reactions tend to slow with kinetic molecular theory – and you’ll see that ahead in the Concentrations of Reactants and Rate Laws pages.
Reaction Rates in Analysis: Test Strips for Urinalysis
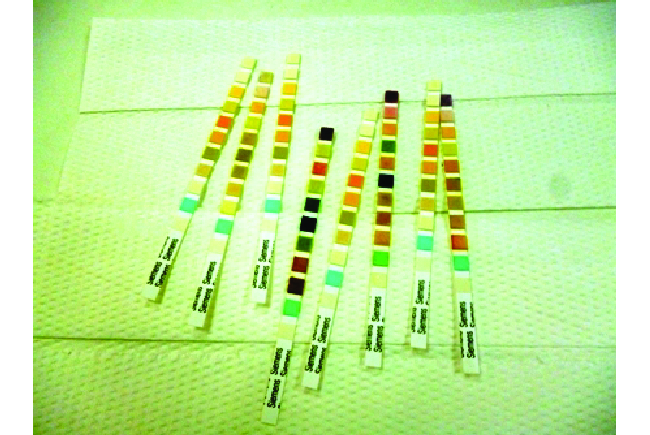
Physicians often use disposable test strips to measure the amounts of various substances in a patient’s urine (see image below). These test strips contain various chemical reagents, embedded in small pads at various locations along the strip, which undergo changes in color upon exposure to sufficient concentrations of specific substances. The usage instructions for test strips often stress that proper read time is critical for optimal results. This emphasis on read time suggests that kinetic aspects of the chemical reactions occurring on the test strip are important considerations.
The test for urinary glucose relies on a two-step process represented by the chemical equations shown here:
$$C_6H_{12}O_6+O_2\;\underrightarrow{catalyst}\;C_6H_{10}O_6+H_2O_2$$ $$2H_2O_2+2I^-\;\underrightarrow{catalyst}\;I_2+2H_2O+O_2$$The first equation depicts the oxidation of glucose in the urine to yield glucolactone and hydrogen peroxide. The hydrogen peroxide produced subsequently oxidizes colorless iodide ion to yield brown iodine, which may be visually detected. Some strips include an additional substance that reacts with iodine to produce a more distinct color change.
The two test reactions shown above are inherently very slow, but their rates are increased by special enzymes embedded in the test strip pad. This is an example of catalysis, a topic discussed later in this chapter. A typical glucose test strip for use with urine requires approximately 30 seconds for completion of the color-forming reactions. Reading the result too soon might lead one to conclude that the glucose concentration of the urine sample is lower than it actually is (a false-negative result). Waiting too long to assess the color change can lead to a false positive due to the slower (not catalyzed) oxidation of iodide ion by other substances found in urine.