The minimum energy necessary to form a product during a collision between reactants is called the activation energy (Ea). How this energy compares to the kinetic energy provided by colliding reactant molecules is a primary factor affecting the rate of a chemical reaction. If the activation energy is much larger than the average kinetic energy of the molecules, the reaction will occur slowly since only a few fast-moving molecules will have enough energy to react. If the activation energy is much smaller than the average kinetic energy of the molecules, a large fraction of molecules will be adequately energetic and the reaction will proceed rapidly.
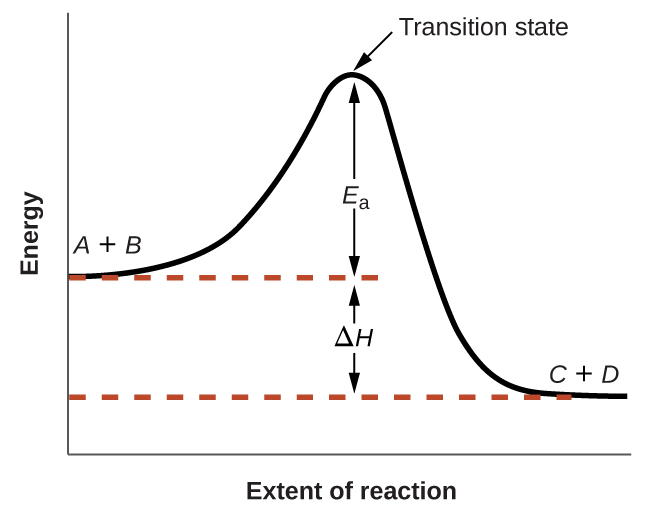
The figure below shows how the energy of a chemical system changes as it undergoes a reaction converting reactants to products according to the equation $$A+B⟶C+D$$
These reaction diagrams are widely used in chemical kinetics to illustrate various properties of the reaction of interest. Viewing the diagram from left to right, the system initially comprises reactants only, A + B. Reactant molecules with sufficient energy can collide to form a high-energy activated complex or transition state. The unstable transition state can then subsequently decay to yield stable products, C + D. The diagram depicts the reaction’s activation energy, Ea, as the energy difference between the reactants and the transition state. Using a specific energy, the enthalpy (see chapter on thermochemistry), the enthalpy change of the reaction, ΔH, is estimated as the energy difference between the reactants and products. In this case, the reaction is exothermic (ΔH < 0) since it yields a decrease in system enthalpy.
The Arrhenius equation relates the activation energy and the rate constant, k, for many chemical reactions:
$$k=Ae^{−E_a/RT} \label{eq1}\tag{1}$$
In this equation, R is the ideal gas constant, which has a value 8.314 J/mol/K, T is temperature on the Kelvin scale, Ea is the activation energy in joules per mole, e is the constant 2.7183, and A is a constant called the frequency factor, which is related to the frequency of collisions and the orientation of the reacting molecules.
Postulates of collision theory are nicely accommodated by the Arrhenius equation. The frequency factor, A, reflects how well the reaction conditions favor properly oriented collisions between reactant molecules. An increased probability of effectively oriented collisions results in larger values for A and faster reaction rates.
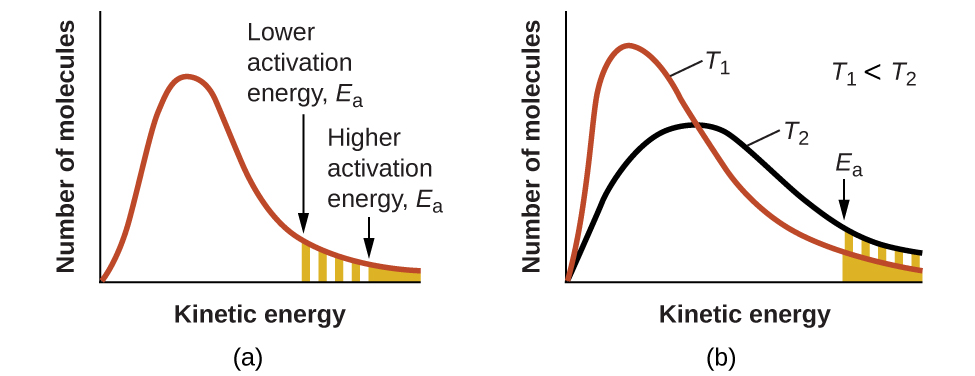
The exponential term, e−Ea/RT, describes the effect of activation energy on reaction rate. According to kinetic molecular theory (see chapter on gases), the temperature of matter is a measure of the average kinetic energy of its constituent atoms or molecules. The distribution of energies among the molecules composing a sample of matter at any given temperature is described by the plot shown in Figure 2(a). Two shaded areas under the curve represent the numbers of molecules possessing adequate energy (RT) to overcome the activation barriers (Ea). A lower activation energy results in a greater fraction of adequately energized molecules and a faster reaction.
The exponential term also describes the effect of temperature on reaction rate. A higher temperature represents a correspondingly greater fraction of molecules possessing sufficient energy (RT) to overcome the activation barrier (Ea), as shown in Figure 2(b). This yields a greater value for the rate constant and a correspondingly faster reaction rate.
A convenient approach for determining Ea for a reaction involves the measurement of k at two or more different temperatures and using an alternate version of the Arrhenius equation that takes the form of a linear equation
$$lnk=\left(\frac{−E_a}{R}\right)\left(\frac{1}{T}\right)+lnA \label{eq2}\tag{2}$$
$$y=mx+b$$
A plot of ln k versus $\frac{1}{T}$ is linear with a slope equal to $\frac{−Ea}{R}$ and a y-intercept equal to ln A.
Determination of Ea
The variation of the rate constant with temperature for the decomposition of HI(g) to H2(g) and I2(g) is given here. What is the activation energy for the reaction?
$$2HI(g)⟶H_2(g)+I_2(g)$$
| T (K) | k (L/mol/s) |
|---|---|
| 555 | 3.52 × 10⁻⁷ |
| 575 | 1.22 × 10⁻⁶ |
| 645 | 8.59 × 10⁻⁵ |
| 700 | 1.16 × 10⁻³ |
| 781 | 3.95 × 10⁻² |
Solution Use the provided data to derive values of $\frac{1}{T}$ and ln k:
| $\frac{1}{T}\;(K^{−1})$ | ln k |
|---|---|
| 1.80 × 10⁻³ | −14.860 |
| 1.74 × 10⁻³ | −13.617 |
| 1.55 × 10⁻³ | −9.362 |
| 1.43 × 10⁻³ | −6.759 |
| 1.28 × 10⁻³ | −3.231 |
The figure below is a graph of ln k versus $\frac{1}{T}$. In practice, the equation of the line (slope and y-intercept) that best fits these plotted data points would be derived using a statistical process called regression. This is helpful for most experimental data because a perfect fit of each data point with the line is rarely encountered. For the data here, the fit is nearly perfect and the slope may be estimated using any two of the provided data pairs. Using the first and last data points permits estimation of the slope.
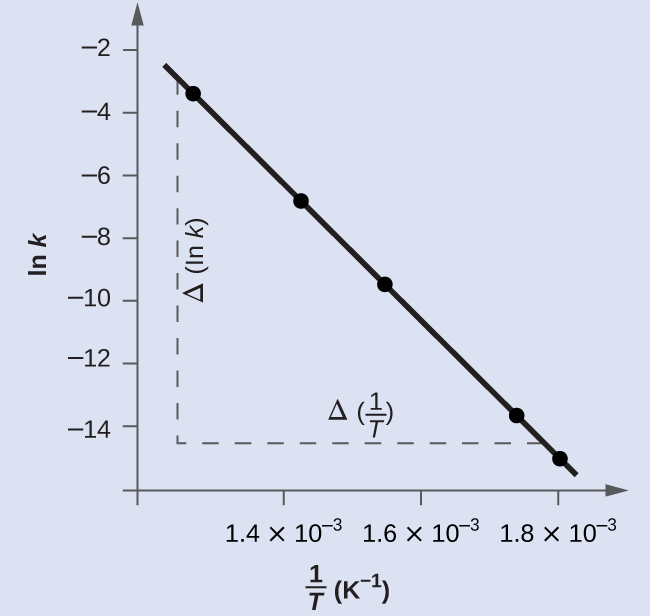
$$Slope=\frac{Δ(lnk)}{Δ(\frac{1}{T})}$$
$$=\frac{(−14.860)−(−3.231)}{(1.80×10^{−3}\;K^{−1})−(1.28×10^{−3}\;K^{−1})}$$
$$=\frac{−11.629}{0.52×10^{−3}\;K^{−1}}=–2.2×10^4\;K$$
$$=\frac{−E_a}{R}$$
$$E_a=−slope×R=−(−2.2×10^4\;K×8.314\;J\;mol^{−1}\;K^{−1})$$
$$1.8×10^5\;J\;mol^{−1}\quad or\quad 180\;kJ\;mol^{−1}$$
Alternative approach: A more expedient approach involves deriving activation energy from measurements of the rate constant at just two temperatures. In this approach, the Arrhenius equation is rearranged to a convenient two-point form:
$$ln\frac{k_1}{k_2}=\frac{E_a}{R}\left(\frac{1}{T_2}−\frac{1}{T_1}\right) \label{eq3}\tag{3}$$
Rearranging this equation to isolate activation energy yields:
$$E_a=−R\left(\frac{lnk_2−lnk_1}{(\frac{1}{T_2})−(\frac{1}{T_1})}\right) \label{eq4}\tag{4}$$
Any two data pairs may be substituted into this equation—for example, the first and last entries from the above data table:
$$E_a=−8.314\;J\;mol^{−1}\;K^{−1}\left(\frac{−3.231−(−14.860)}{1.28×10^{−3}\;K^{−1}−1.80×10^{−3}\;K^{−1}}\right)$$
and the result is Ea = 1.8 × 10⁵ J mol−1 or 180 kJ mol−1
This approach yields the same result as the more rigorous graphical approach used above, as expected. In practice, the graphical approach typically provides more reliable results when working with actual experimental data.
Check your learning
The rate constant for the rate of decomposition of N2O5 to NO and O2 in the gas phase is 1.66 L/mol/s at 650 K and 7.39 L/mol/s at 700 K:
$$2N_2O_5(g)⟶4NO(g)+3O_2(g)$$
Assuming the kinetics of this reaction are consistent with the Arrhenius equation, calculate the activation energy for this decomposition.
Answer:
$1.1 \times 10^5 \frac{\text{J}}{\text{mol}}$
Check Your Learning
Can you label a reaction coordinate diagram correctly? Test your understanding in this question below: