The Paradox of Discrete Spectra
In the late 1800’s, scientists struggled with a concerned of classical eletromagnetic theory: how atoms and molecules emit light. When you heat solids, liquids, or condensed gases sufficiently, they radiate excess energy as light. This light contains photos with a range of energies, creating a continues spectrum with an unbroken series of wavelengths. Most of the light from stars, including our sun, is produced in this way. You can observe all the colors of visible light in sunlight by using a prism to separate them.
Sunlight also contains UV light (shorter wavelengths) and IR light (longer wavelengths) as shown on the spectra in the previous page, detectable by instruments but not the human eye. Incandescent (glowing) solids, like tungsten filaments, emit light with all visible wavelength. You can often approximate these continuous spectra with blackbody radiation curves at suitable temperature, such as those shown in the previous page.
Discrete Light
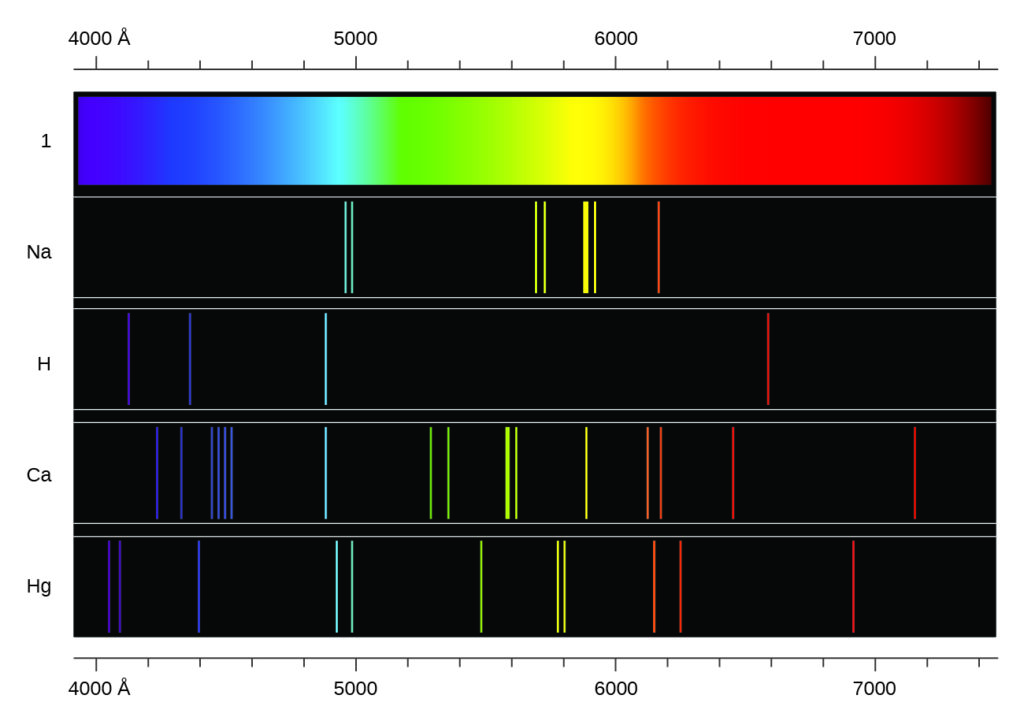
In contrast, light can also appear as discrete or line spectra with narrow line widths, as shown in FIgure 2. Exciting a gas at low partial pressure using an electrical current, or heating it, it emits these lines spectra. Fluorescent light bulbs and neon signs operate in this way (Figure 1). Each element displays its own characteristic set of lines, as do molecules, although their spectra are generally much more complicated.

(credit: Dave Shaver)
Emission Lines and Balmer’s Equation
Each emission line has a single wavelength of light, which implies that the light emitted by a gas consists of a set of discrete energies. For example, an electric current passes through a tube containing hydrogen gas at low pressure, the H2 molecules break apart into separate H atoms, creating a blue-pink glow. This light in a line spectrum shows four visible wavelengths when passed through a prism, see in Figure 2.
In the late nineteenth century, scientists found discrete spectra in atoms and molecules extremely puzzling, as classical electromagnetic theory predicted only continuous spectra. So, in 1885, Johann Balmer derived an empirical equation linking four visible wavelengths of hydrogen atoms to whole integers. That equation is the following one, in which k is a constant:
$$\frac{1}{λ}=k(\frac{1}{4}-\frac{1}{n^2}),\;n=3,\;4,\;5,\;6$$The Rydberg Formula
Other discrete lines for the hydrogen atom were found in the UV and IR regions. Johannes Rydberg generalized Balmer’s work and developed an empirical formula that predicted all of hydrogen’s emission lines, not just those restricted to the visible range, where, n1 and n2 are integers, n1 < n2, and R∞ is the Rydberg constant (1.097 × 10⁷ m−1).
$$\frac{1}{λ}=R_∞(\frac{1}{n_1^2}-\frac{1}{n_2^2})$$Even in the late nineteenth century, scientists measured the wavelengths of hydrogen with great precision in spectroscopy. This high accuracy implied that they could also determine the Rydberg constant very precisely. That such a simple formula as the Rydberg formula could account for such precise measurements seemed astounding at the time. Ultimately, it was the eventual explanation for emission spectra by Neils Bohr in 1913 that convinced scientists to abandon classical physics and spurred the development of modern quantum mechanics.