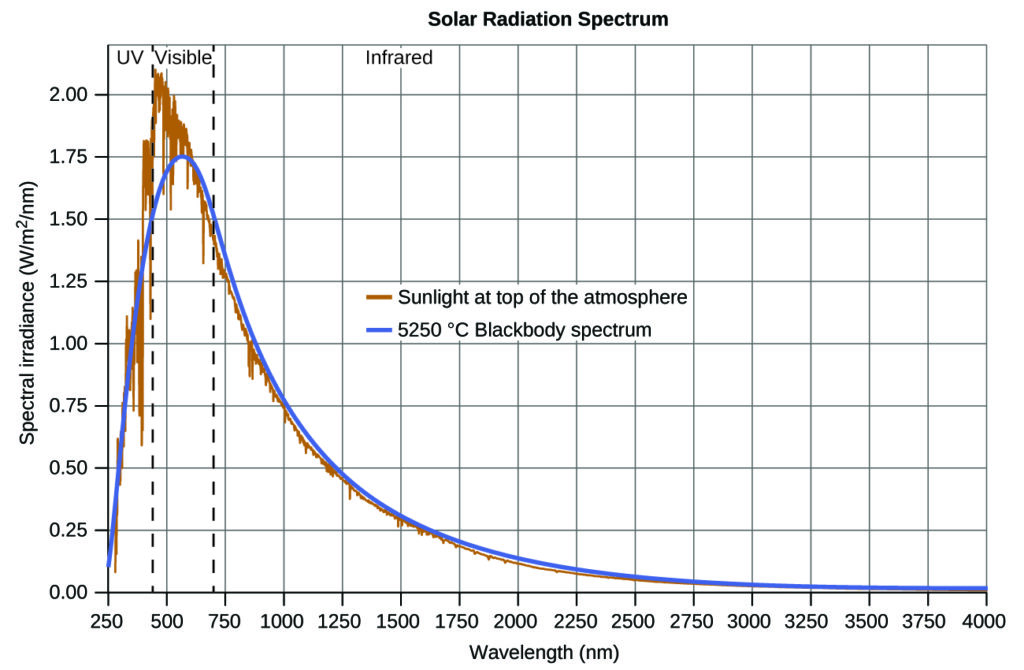
The last few decades of the nineteenth century witnessed intense research activity in commercializing newly discovered electric lighting. This required gaining a better understanding of the light distributions emitted from various sources. Designers usually create artificial lighting to mimic natural sunglight within the limitations of the underlying technology. Such lighting consists of a range of broadly distributed frequencies that form a continuous spectrum. Figure 1 shows the wavelength distribution for sunlight. The intensity drops rapidly for shorter ultraviolet (UV) wavelengths and more slowly for longer infrared (IR) wavelengths.
Comparing Solar and Blackbody Spectra
Figure 1 compares the solar distribution to a blackbody spectrum at 5250 °C. The blackbody spectrum closely matches the solar spectrum. The blackbody spectrum matches the solar spectrum quite well. A blackbody is a convenient, ideal emitter that approximates the behavior of many materials when heated. It serves as a convenient representation, similar to how an ideal gas represents real gases.
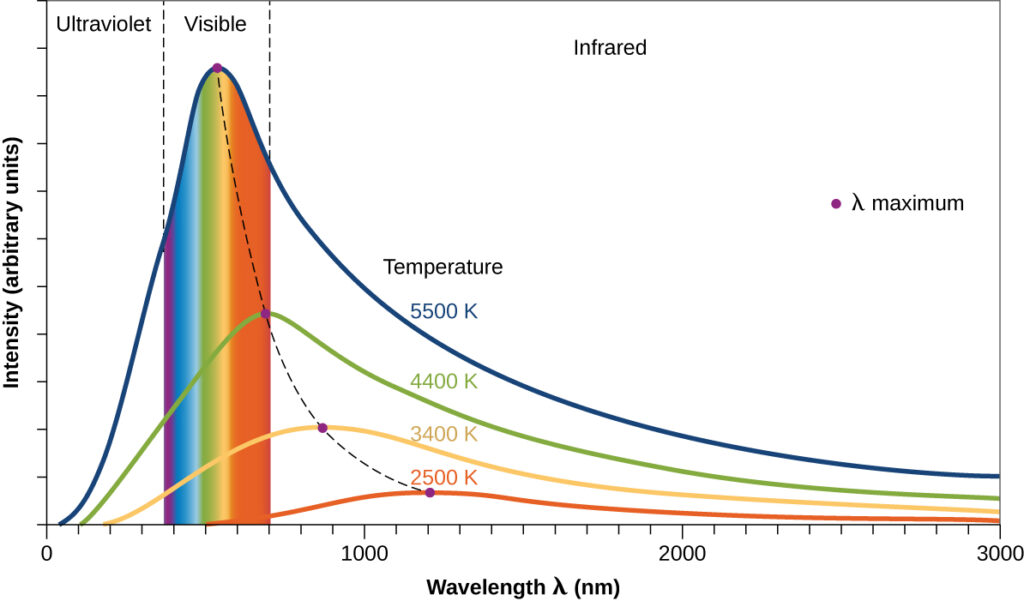
A metal oven, heated to very high temperatures, serves as a good approximation of a blackbody for observing blackbody radiation. The oven’s small hole lets you use a spectrometer to measure emitted light’s wavelengths and intensities. Figure 2 shows the resulting curves for some representative temperatures. Each distribution depends only on a single parameter: the temperature. The maxima in the blackbody curves, λmax, shift to shorter wavelengths as the temperature increases. This reflects the observation that metals heated to high temperatures begin to glow a darker red that becomes brighter as the temperature increases, eventually becoming white hot at very high temperatures as the intensities of all of the visible wavelengths become appreciable. This observation highlighted the first paradox revealing classical physics’ limitations.
Ultraviolet Catastrophe: Planks Breakthrough in Blackbody Radiation
Physicists derived mathematical expressions for the blackbody curves using well-accepted concepts from the theories of classical mechanics and classical electromagnetism. These expressions accurately fit the observed blackbody curves at longer wavelengths but showed significant discrepancies at shorter wavelengths. Instead of showing a peak, the theoretical curves absurdly predicted infinite intensity as the wavelength decreased. This implied that everyday objects at room temperature should emit large amounts of UV light, leading to the “ultraviolet catastrophe.” No one could find errors in the theoretical treatment to explain this unrealistic short-wavelength behavior.
Finally, around 1900, Max Planck derived a theoretical expression for blackbody radiation that fit the experimental observations exactly (within experimental error). Planck developed his theoretical treatment by extending the earlier work that had been based on the premise that the atoms composing the oven vibrated at increasing frequencies (or decreasing wavelengths) as the temperature increased, with these vibrations being the source of the emitted electromagnetic radiation. But where the earlier treatments had allowed the vibrating atoms to have any energy values obtained from a continuous set of energies (perfectly reasonable, according to classical physics), Planck found that by restricting the vibrational energies to discrete values for each frequency, he could derive an expression for blackbody radiation that correctly had the intensity dropping rapidly for the short wavelengths in the UV region.
$$E\;=\;nhν,\quad n\;= \; 1, \; 2, \; 3, \, . \, . \, .$$
Planck’s constant (h)
The quantity h is a constant, known as Planck’s constant, in his honor. Although Planck was pleased he had resolved the blackbody radiation paradox, he was disturbed that to do so, he needed to assume the vibrating atoms required quantized energies, which he was unable to explain. The value of Planck’s constant is very small, 6.626 × 10⁻³⁴ joule seconds (J s), which helps explain why energy quantization had not been observed previously in macroscopic phenomena.