If we partially fill an airtight syringe with air, the syringe contains a specific amount of air at constant temperature, say 25 °C. If we slowly push in the plunger while keeping temperature constant, the gas in the syringe is compressed into a smaller volume and its pressure increases; if we pull out the plunger, the volume increases and the pressure decreases. This example of the effect of volume on the pressure of a given amount of a confined gas is true in general. Decreasing the volume of a contained gas will increase its pressure, and increasing its volume will decrease its pressure. In fact, if the volume increases by a certain factor, the pressure decreases by the same factor, and vice versa. Volume-pressure data for an air sample at room temperature are graphed in [link].
Unlike the P–T and V–T relationships, pressure and volume are not directly proportional to each other. Instead, P and V exhibit inverse proportionality: Increasing the pressure results in a decrease of the volume of the gas. Mathematically this can be written: $$Pα\frac{1}{V}\quad or\quad P=k·\frac{1}{V}\quad or\quad P·V=k\quad or\quad P_1V_1=P_2V_2$$
with k being a constant. Graphically, this relationship is shown by the straight line that results when plotting the inverse of the pressure ($\frac{1}{P}) versus the volume (V), or the inverse of volume ($\frac{1}{V}$) versus the pressure (P). Graphs with curved lines are difficult to read accurately at low or high values of the variables, and they are more difficult to use in fitting theoretical equations and parameters to experimental data. For those reasons, scientists often try to find a way to “linearize” their data. If we plot P versus V, we obtain a hyperbola (see [link]).
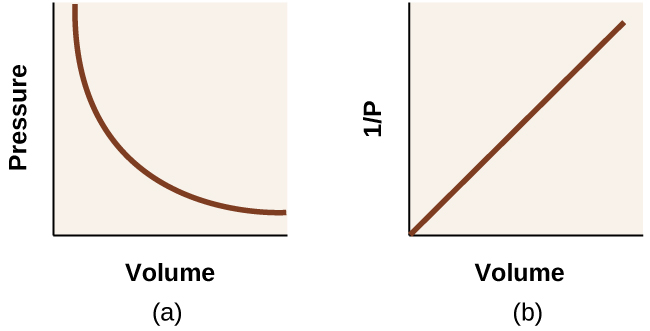
The relationship between the volume and pressure of a given amount of gas at constant temperature was first published by the English natural philosopher Robert Boyle over 300 years ago. It is summarized in the statement now known as Boyle’s law: The volume of a given amount of gas held at constant temperature is inversely proportional to the pressure under which it is measured.
Volume of a Gas Sample
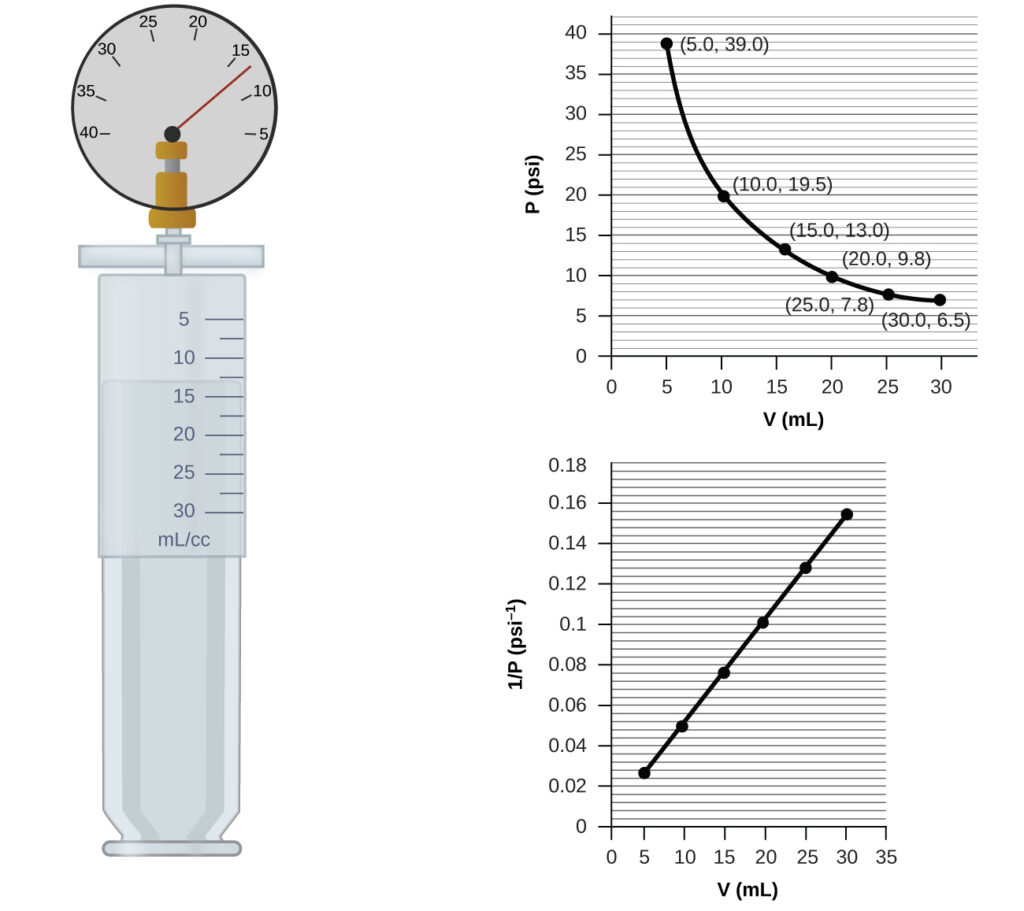
The sample of gas in [link] has a volume of 15.0 mL at a pressure of 13.0 psi. Determine the pressure of the gas at a volume of 7.5 mL, using:
(a) the P–V graph in [link]
(b) the $\frac{1}{P}$ vs. V graph in [link]
(c) the Boyle’s law equation
Comment on the likely accuracy of each method.
Solution
(a) Estimating from the P–V graph gives a value for P somewhere around 27 psi.
(b) Estimating from the $\frac{1}{P}$ versus V graph give a value of about 26 psi.
(c) From Boyle’s law, we know that the product of pressure and volume (PV) for a given sample of gas at a constant temperature is always equal to the same value. Therefore we have P1V1 = k and P2V2 = k which means that P1V1 = P2V2.
Using P1 and V1 as the known values 13.0 psi and 15.0 mL, P2 as the pressure at which the volume is unknown, and V2 as the unknown volume, we have: $$P_1V_1=P_2V_2\quad or\quad 13.0\;psi\times 15.0\;mL=P_2\times 7.5\;mL$$
Solving: $$P2=\frac{13.0\;psi\times 15.0\;\require{enclose}\enclose{horizontalstrike}{mL}}{7.5\;\enclose{horizontalstrike}{mL}}=26\;psi$$
It was more difficult to estimate well from the P–V graph, so (a) is likely more inaccurate than (b) or (c). The calculation will be as accurate as the equation and measurements allow.
Check Your Learning
The sample of gas in [link] has a volume of 30.0 mL at a pressure of 6.5 psi. Determine the volume of the gas at a pressure of 11.0 psi, using:
(a) the P–V graph in [link]
(b) the $\frac{1}{P}$ vs. V graph in [link]
(c) the Boyle’s law equation
Comment on the likely accuracy of each method. Answer:
(a) about 17–18 mL; (b) ~18 mL; (c) 17.7 mL; it was more difficult to estimate well from the P–V graph, so (a) is likely more inaccurate than (b); the calculation will be as accurate as the equation and measurements allow
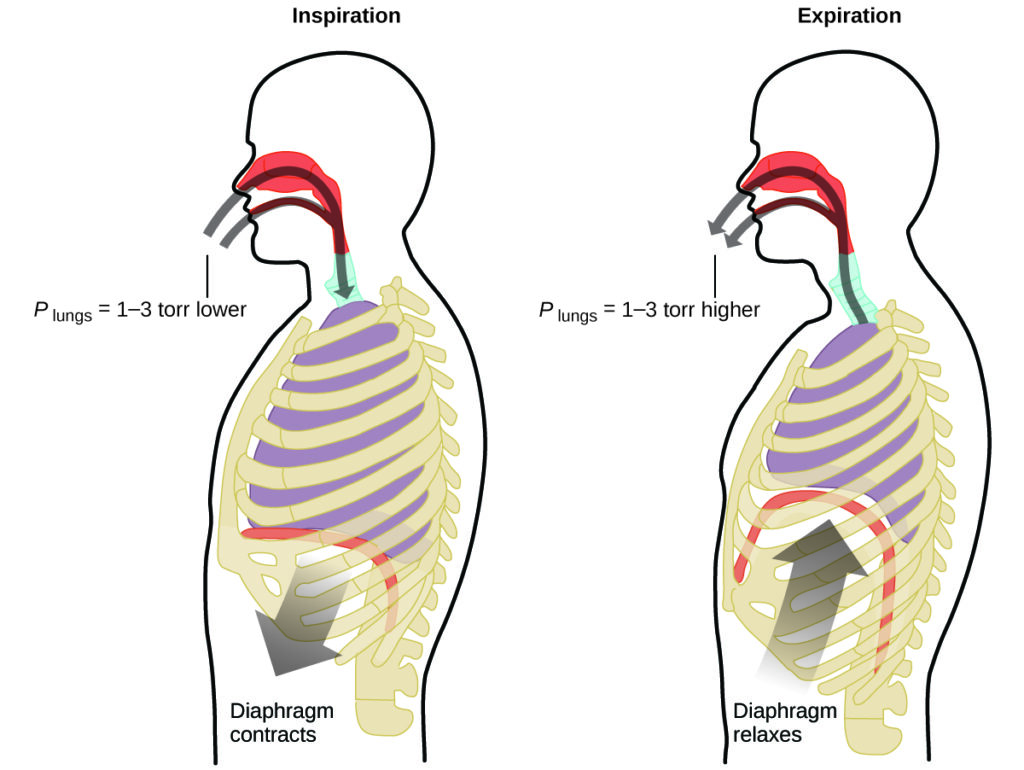
Breathing and Boyle’s Law
What do you do about 20 times per minute for your whole life, without break, and often without even being aware of it? The answer, of course, is respiration, or breathing. How does it work? It turns out that the gas laws apply here. Your lungs take in gas that your body needs (oxygen) and get rid of waste gas (carbon dioxide). Lungs are made of spongy, stretchy tissue that expands and contracts while you breathe. When you inhale, your diaphragm and intercostal muscles (the muscles between your ribs) contract, expanding your chest cavity and making your lung volume larger. The increase in volume leads to a decrease in pressure (Boyle’s law). This causes air to flow into the lungs (from high pressure to low pressure). When you exhale, the process reverses: Your diaphragm and rib muscles relax, your chest cavity contracts, and your lung volume decreases, causing the pressure to increase (Boyle’s law again), and air flows out of the lungs (from high pressure to low pressure). You then breathe in and out again, and again, repeating this Boyle’s law cycle for the rest of your life ([link]).