The rate of a reaction depends on the nature of the participating substances. Reactions that appear similar may have different rates under the same conditions, depending on the identity of the reactants. For example, when small pieces of the metal’s iron and sodium are exposed to air, the sodium reacts completely with air overnight, whereas the iron will barely be affected. The active metals calcium and sodium both react with water to form hydrogen gas and a base. Yet calcium reacts at a moderate rate, whereas sodium reacts so rapidly that the reaction is almost explosive.
Activation Energy
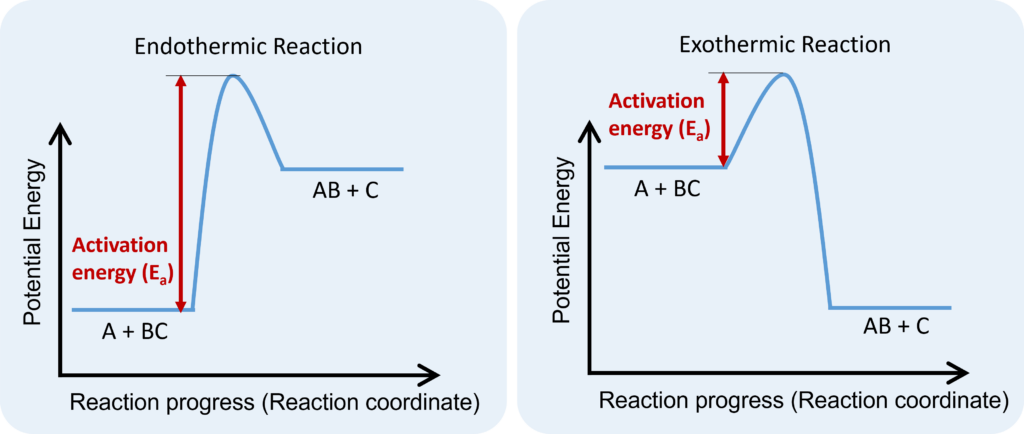
One of the factors in this “chemical nature” is the activation energy (Ea) of the reaction. This is the minimum energy required to start a reaction. You have experienced activation energies, even if you didn’t know it! Think of the combustion (burning) of gasoline in the air – this reaction is spontaneous (once it starts, it will continue reacting until it runs out of reactants, without needing any help) but a can of gasoline can sit in the air without lighting on fire. It needs a spark or some heat (energy) in order to start the reaction.
Reactions with a small activation energy need only a small energy input – the thermal energy at the reaction’s current temperature may be enough. The larger the activation energy, the slower a reaction will be, as more energy is required.
Reaction Coordinate Diagrams
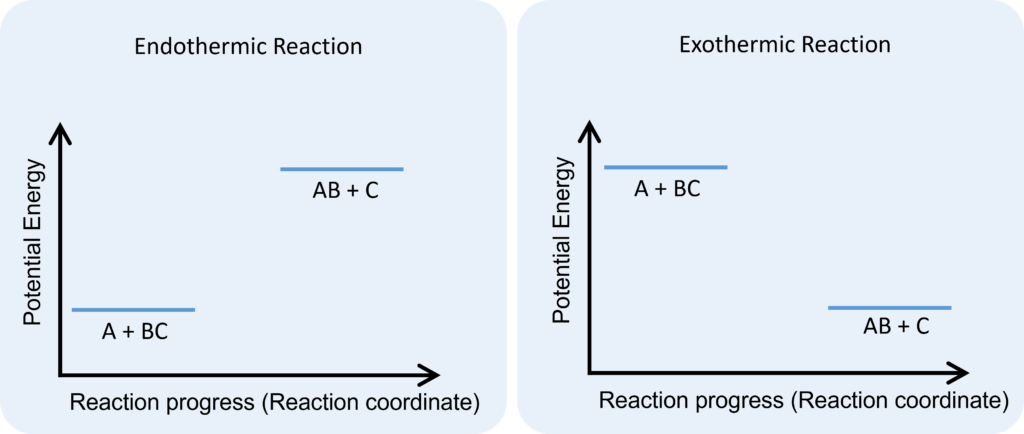
We can use reaction coordinate diagrams to show the relative energies of reaction components. To create a reaction coordinate diagram, we place our reactants and products on a plot, with Energy on the y-axis. (Properly, this should be Gibbs free energy ($\Delta G$) but values for enthalpy ($\Delta H$) are very similar, so either can be used. The axis is often just labeled “Energy”).
The x-axis is the reaction progress or reaction coordinate and is an imagined progression from reactants (on the left) to products (on the right). The x-axis is NOT time, and its scale (where things are along the axis) has no meaning other than the general progression from left to right.
This figure shows the reactants and products for an exothermic reaction and an endothermic reaction for the imaginary reaction $A + BC \rightarrow AB+C$:
Connecting the reactants and products with a line symbolizing the progress from reactants to products completes the reaction coordinate diagram. The curve of the line shows the energy input (or output) during the process.
The chemical nature of the reactants (and products) is a factor in the size of the activation energy – and therefore the rate of the reaction. Exactly how the activation energy is determined and measured will be discussed more in the section on collision theory in kinetics.