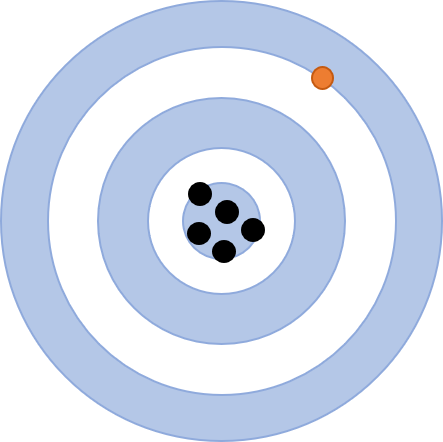
An outlier is a measured value that does not quite “fit” with the rest of the measurements, like the orange dot when compared to the rest of the black cluster below:
Outliers can be due to a mistake during the measurement, or due to a particularly large random fluctuation of the experimental parameters. Leaving an outlier in your data set during your calculations can increase the uncertainty of your final values, and could bias (decrease the accuracy of) your final result.
However, to avoid creating a bias in your data (towards the value you expect or want), if there wasn’t a mistake in that measurement, you should always test statistically to see if a suspicious value is really an outlier before eliminating it. If there was a mistake – you overshot a titration, for example – you can eliminate the faulty data point without a test.
How to test for outliers
- Calculate the mean ($ \bar{x} $) and standard deviation ($ s $) of your data set, including the suspicious point.
- Calculate the Grubbs factor $G$ using this formula: $$ G = \frac{\left| questionable\; value – \bar{x} \right|}{s} $$
- Compare your calculated $G$ value to the $G_{reference}$ values in the table below. Use the value that best matches the number of data points (observations) in your data set.
If you need more values or more significant figures, you can calculate your own Greference values using Excel. - Compare your calculated $G$ value to the $G_{reference}$ value.
- If your calculated value is SMALLER than or EQUAL to the reference value: there is at least a 5% chance that your suspicious data point is actually correct. You should leave it in your data set.
- If your calculated value is LARGER than the reference value: there is less than a 5% chance that your suspicious data point is actually correct. It can be safely discarded.
- If you discarded the data point, you should re-calculate your average (and standard deviation, if you will use it) without this data point before continuing your calculations.
Since most of the data sets you will deal with in course-based labs are small (less than 100 data points), never discard more than one data point as an outlier, using the Grubbs test or another method. Discarding multiple points can increase the uncertainty in your data set overall. Pro Tip: Since you can only ever eliminate one data point, there is only one point in your data set that is worth testing.
| Number of observations | Gtable (95% confidence) |
| 4 | 1.463 |
| 5 | 1.672 |
| 6 | 1.822 |
| 7 | 1.938 |
| 8 | 2.032 |
| 10 | 2.176 |